San Antonians’ Behavioral and Attitudinal Happiness Relative to Social Economic Status
This paper is based on JoAnna L. Secor (Northwest Vista College), Michael C. DeLeon (Northwest Vista College), and Donald R. Lucas’ (Northwest Vista College) 2023 Southwestern Psychological Association convention talk titled, San Antonians’ Behavioral and Attitudinal Happiness Relative to Social Economic Status.

Have you ever wondered how happy your city is? Well, wonder no more for you are about to learn a scientific method for measuring your city’s happiness.
With all the post COVID pandemic strife in the World today, this study began with a simple and personal curiosity about answering the question: How happy is San Antonio, Texas — the city in which the researchers reside.
We are not the first to be curious about measuring a city’s happiness. In fact, for health, economic, and tourist reasons, there is a whole research literature associated with judging happiness of cities. This research literature has studies measuring subjective ratings from city dwellers, simply asking them, “how happy is your city?” And studies measuring sociological aspects of cities, including such things as cities’ crime rates, employment rates, divorce rates, health insurance rates, or cost of living rates. And studies measuring geographical aspects of the cities, such as the number of parks, the number of sunny days, the number of churches, the number of amusement parks, the number of lakes, or the number of festivals.
These measures are all well-and-good, but they tell us little about how happy the city is relative what the city dweller is doing on a day-to-day basis.
PURPOSE
Thus, we set out to find how happy a city is by scientifically measuring what its dwellers are doing relative to happiness. We did this in two ways: Behaviorally and attitudinally.
METHODS
Behavioral Happiness
We behaviorally defined happiness in two ways: One way was by prosocial behaviors — we know people who are happy are more likely to help others.
We measured prosocial behavior by measuring the probability a San Antonian in a public place, picks-up a wallet and gives the wallet back to a stranger, after witnessing the stranger drop the wallet out of their pocket.
The second way we behaviorally defined happiness was by reciprocal smiling — people who are happy are more likely to smile back at someone who smiles at them.
We measured reciprocal smiling by measuring whether a San Antonian in a public place, smiles, frowns, or makes no change in facial expression after seeing a stranger smile at them.
Attitudinal Happiness
We attitudinally defined happiness in two ways: One way was by one’s judgment of themselves — people who are happy are more likely to judge themselves as being happy.

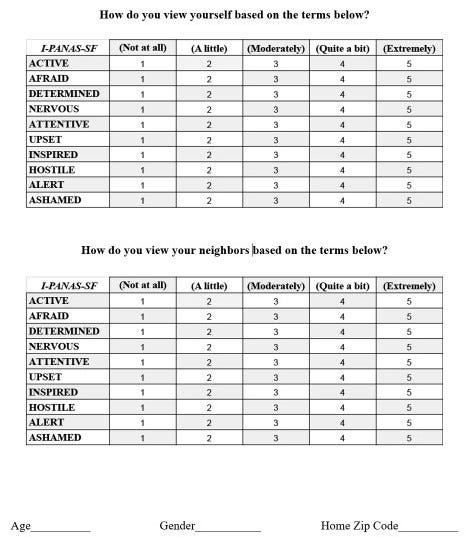
We measured judgment-of-themselves happiness by asking San Antonians to complete a brief survey with questions about happiness, and prosocial and reciprocal smiling situations (see Table 1). San Antonians answered these questions about themselves using a 5-point Likert Scale with 1 equaling “absolutely no” or “very unhappy” and 5 equaling “absolutely yes” or “very happy.” The survey also included a scientifically validated, 10-question, five-point Likert measure of happiness called the Positive and Negative Affect Schedule (see Table 2). The Positive and Negative Affect Schedule or PANAS yields a person’s positive affect score (pas — analogous to positive, healthy, and adaptive emotions) and negative affect score (nas — analogous to negative, unhealthy, and maladaptive emotions).
The second way we attitudinally defined happiness was by one’s judgment of others — people who are happy are more likely to judge others as being happy too.
We measured judgment-of-others happiness by asking San Antonians to complete a brief survey with a question about their neighbor’s happiness. San Antonians answered this question using a 5-point Likert Scale with 1 equaling “very unhappy” and 5 equaling “very happy.” The San Antonians also completed the PANAS again — this time not about themselves, but instead with their neighbors in-mind (see Table 2).
To get a broad sampling of the nearly 1.5 million people living in San Antonio, the behavioral and attitudinal measures were taken in different social economic statuses of the city.
The behavioral measures were taken in Low, Medium, and High SES areas of San Antonio as determined by zip codes. The Low SES area had a median household income of $26,650 (zip code: 78207), the Medium SES area had a median household income of $74,042 (zip code: 78209), and the High SES area had a median household income of $103,092 (zip code: 78258).
The attitudinal measures included a question about what zip code the participant resided in San Antonio. This resulted in 38 different zip codes with median household incomes ranging from $24,455 to $134,941.
Note, this is a between-subjects study: The San Antonians in the prosocial condition were different from the San Antonians in the reciprocal smiling condition who were different from the San Antonians in the attitudinal conditions.
RESULTS
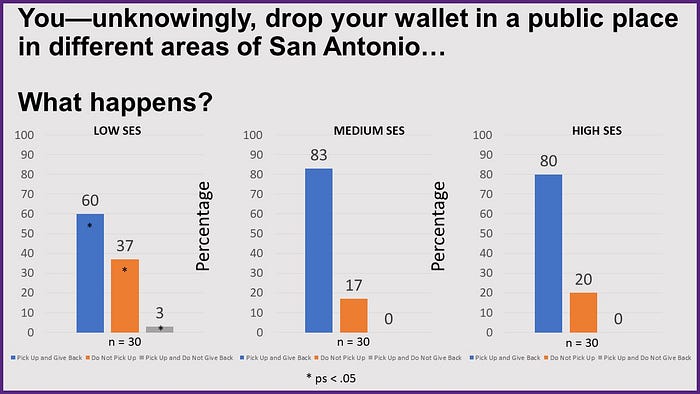
Ninety San Antonians individually witnessed a stranger in public unknowingly drop his wallet. Of these 90 San Antonians, 75% picked up the wallet and gave it back to the stranger, 24% did not pick up the wallet, and 1% picked up the wallet, but did not give it back to the stranger.
Figure 2 shows, when compared to the Medium SES area (83%, 17%, 0%, respectively) and High SES area (80%, 20%, 0%, respectively) of San Antonio, the Low SES area of San Antonio significantly differed in its probabilities of the wallet being picked up and given back (60%), not picked up (37%), and picked up, but not given back (3%, ps < .05).
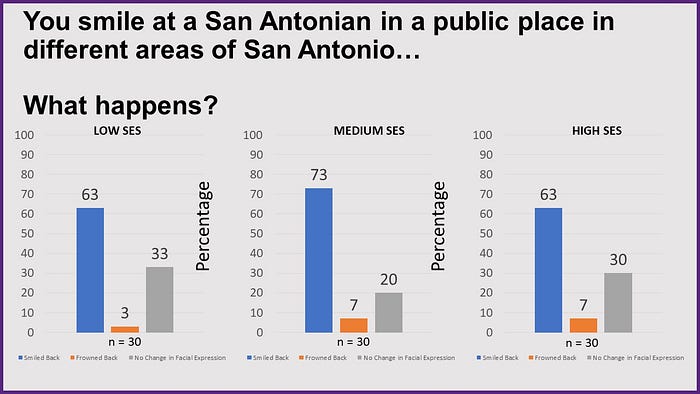
Ninety different San Antonians individually saw a stranger in public make eye contact, then smile at them. Of these 90 San Antonians, 67% smiled back at the stranger, 6% frowned, and 28% made no change in their facial expression.
Figure 3 shows Low (63%, 3%, 33%, respectively), Medium (73%, 7%, 20%, respectively), and High (63%, 7%, 30%, respectively) SES areas of San Antonio had no statistically significant effects on San Antonians smiling, frowning, or having no change in facial expression to the stranger smiling at them (ps > .05).
Ninety-three different San Antonians with a mean age of 36.7 years (SD = 13.8; 53% female, 46% male, 1% other) completed our brief survey (see Tables 1 and 2) composed of questions about happiness, and prosocial and reciprocal smiling situations and the PANAS (see Figure 4).

Of these 93 San Antonians, 90% answered, “absolutely yes” to the statement: “If I saw a stranger in my neighborhood and they dropped their wallet, then I would pick up the wallet and give it back to them.”
Eighty-three percent of San Antonians answered, “absolutely yes” to the statement: “If I saw a stranger in my neighborhood and they smiled at me, then I would smile back at them.”
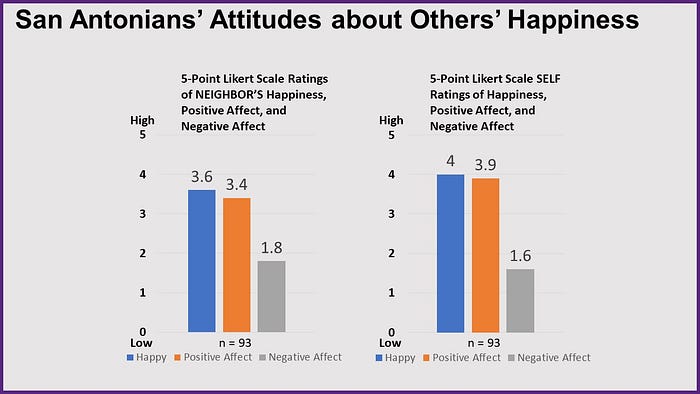
And, when judging themselves on a 5-Point Likert Scale, San Antonians rated their own happiness as a 4 (SD = 0.8), their PANAS positive affect score (pas) as a 3.9 (SD = 1.0), and their PANAS negative affect score (nas) as a 1.6 (SD = 0.7).
When judging their neighbors on a 5-Point Likert Scale, San Antonians rated their neighbors’ happiness as a 3.6 (SD = 0.8), their PANAS pas as a 3.4 (SD = 1.1), and their PANAS nas as a 1.8 (SD = 0.9). As shown in Figure 5, in comparison to how they rated themselves, San Antonians rated their neighbors as less happy with less positive affect and more negative affect.
Using median household incomes derived from their home zip codes, we split the 93 San Antonians who completed our survey into a high SES group (n = 46, M = $101,052, SD = 17,453) and a low SES group (n = 47, M = $46,600, SD = 12,814).
Figure 6 shows the high and low SES groups differed in their answers to the “wallet” (96% and 85%, respectively) and “smile” (93% and 72%, respectively) questions.
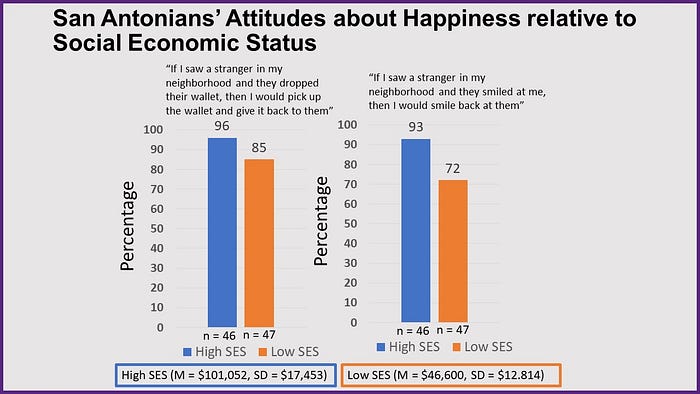
Figure 7 shows the high and low SES groups also differed in their judgments about their own happiness (4.2 and 3.9, respectively), their neighbor’s happiness (3.8 and 3.5, respectively), and their neighbors on the PANAS (pas 3.6 and 3.2, respectively; nas 1.7 and 2.0, respectively; ps < .05).

The high and low SES groups did not differ in their judgments about themselves on the PANAS (pas 4.0 and 3.9, respectively; nas 1.5 and 1.7, respectively).
DISCUSSION
The present study’s overall results make clear San Antonio, Texas is a happy city.
There is a 75% chance San Antonians will help others in distress.
There is a 67% chance San Antonians will smile at strangers.
Ninety percent of San Antonians view themselves as helpers for others in distress.
Eighty-three percent of San Antonians view themselves as reciprocators of kindness.
Seventy-six percent of San Antonians judge themselves as being happy while 58% of San Antonians judge their neighbors as being happy.
Simply put, we are a lot happier than the post COVID pandemic news presents us as being.
Our study’s results also show San Antonio’s happiness is not all rainbows and unicorns. San Antonio’s happiness is affected by social economic status and cognitive dissonance. Specifically, higher SES areas of San Antonio are more likely to yield helping behaviors for strangers in distress. And people living in these higher SES areas are more likely to judge themselves and their neighbors as being happy than those living in lower SES areas of San Antonio. And interestingly, those living in higher SES areas of San Antonio have higher levels of dissonance between believing they would be helping strangers in distress and being kind to them when compared to those living in lower SES areas of San Antonio who have less dissonant perspectives of their helping behavior and kindness.
These results must be viewed relative to several limitations in this study: The first limitation is how we gathered the participants to be a part of this study. Although we sampled from 38 different Zip Codes across the city — San Antonio has a total of 66 Zip Codes. For a true sampling of San Antonio, future research should cover all 66 Zip Codes. The second limitation is this is a correlational study — although we found statistically significant differences between social economic statuses when it comes to behaviors and attitudes associated with happiness, the present study design does not allow us to say these differences were caused by social economic status. Lastly, this is the first study of its kind, thus the present results have yet to be replicated.
Despite these limitations, this study created a scientifically robust and replicable method for measuring a city’s happiness. By combining behavioral and attitudinal measures of happiness, we found San Antonio, Texas to be relatively happy.
Future research will have us replicating this study especially as it relates to social economic status and cognitive dissonance. And applying this study’s methods to cities beyond San Antonio.
So, if you really want to know whether your city is happy, then send us an invitation…
REFERENCES
Ballas, D. (2013). What Makes a ‘Happy City’? Cities, 32, S39-S50.
Collins, T. (2022). Survey: 4 in 10 People are Still Unhappy Two Years in COVID Pandemic. USA Today.
Income By Zip Code, Income Statistics for Texas Zip Codes.
McMillin, D. (2023). America’s Best Places to Live in 2023. Bankrate.
Ray, J. (2022). World Unhappier, More Stressed Out Than Ever. Gallup.
United States Census Bureau, Quick Facts, San Antonio, Texas.
Warnick, M. (2016). How Much Do You Love Your City? Psychology Today.
…
JoAnna Secor is a sophomore-level psychology major at Northwest Vista College. Michael C. DeLeon is a sophomore-level psychology major at Northwest Vista College. Dr. Don Lucas, Ph.D. is a Professor of Psychology and head of the Psychology Department at Northwest Vista College in San Antonio Texas.
If you are interested in the science of psychology and human sexuality, then check out https://humansexuality.medium.com/ and https://www.youtube.com/channel/UCQFQ0vPPNPS-LYhlbKOzpFw/
Happiness, San Antonio, Positive Psychology, Health, Science, Social Sciences, Health Psychology, Psychology, Community
